
Using AI for 30% increase in qualified leads
I was the UX Designer and Conversational Strategist for a chatbot that became Hewlett Packard Enterprise’s (HPE) most efficient early-funnel channel.
30% increase in qualified leads vs. traditional gated content
50% improvement in completion rate (8% →12%)
33% reduction in cost per lead ($180 → $120)
85% data quality rate (vs. 60% baseline)
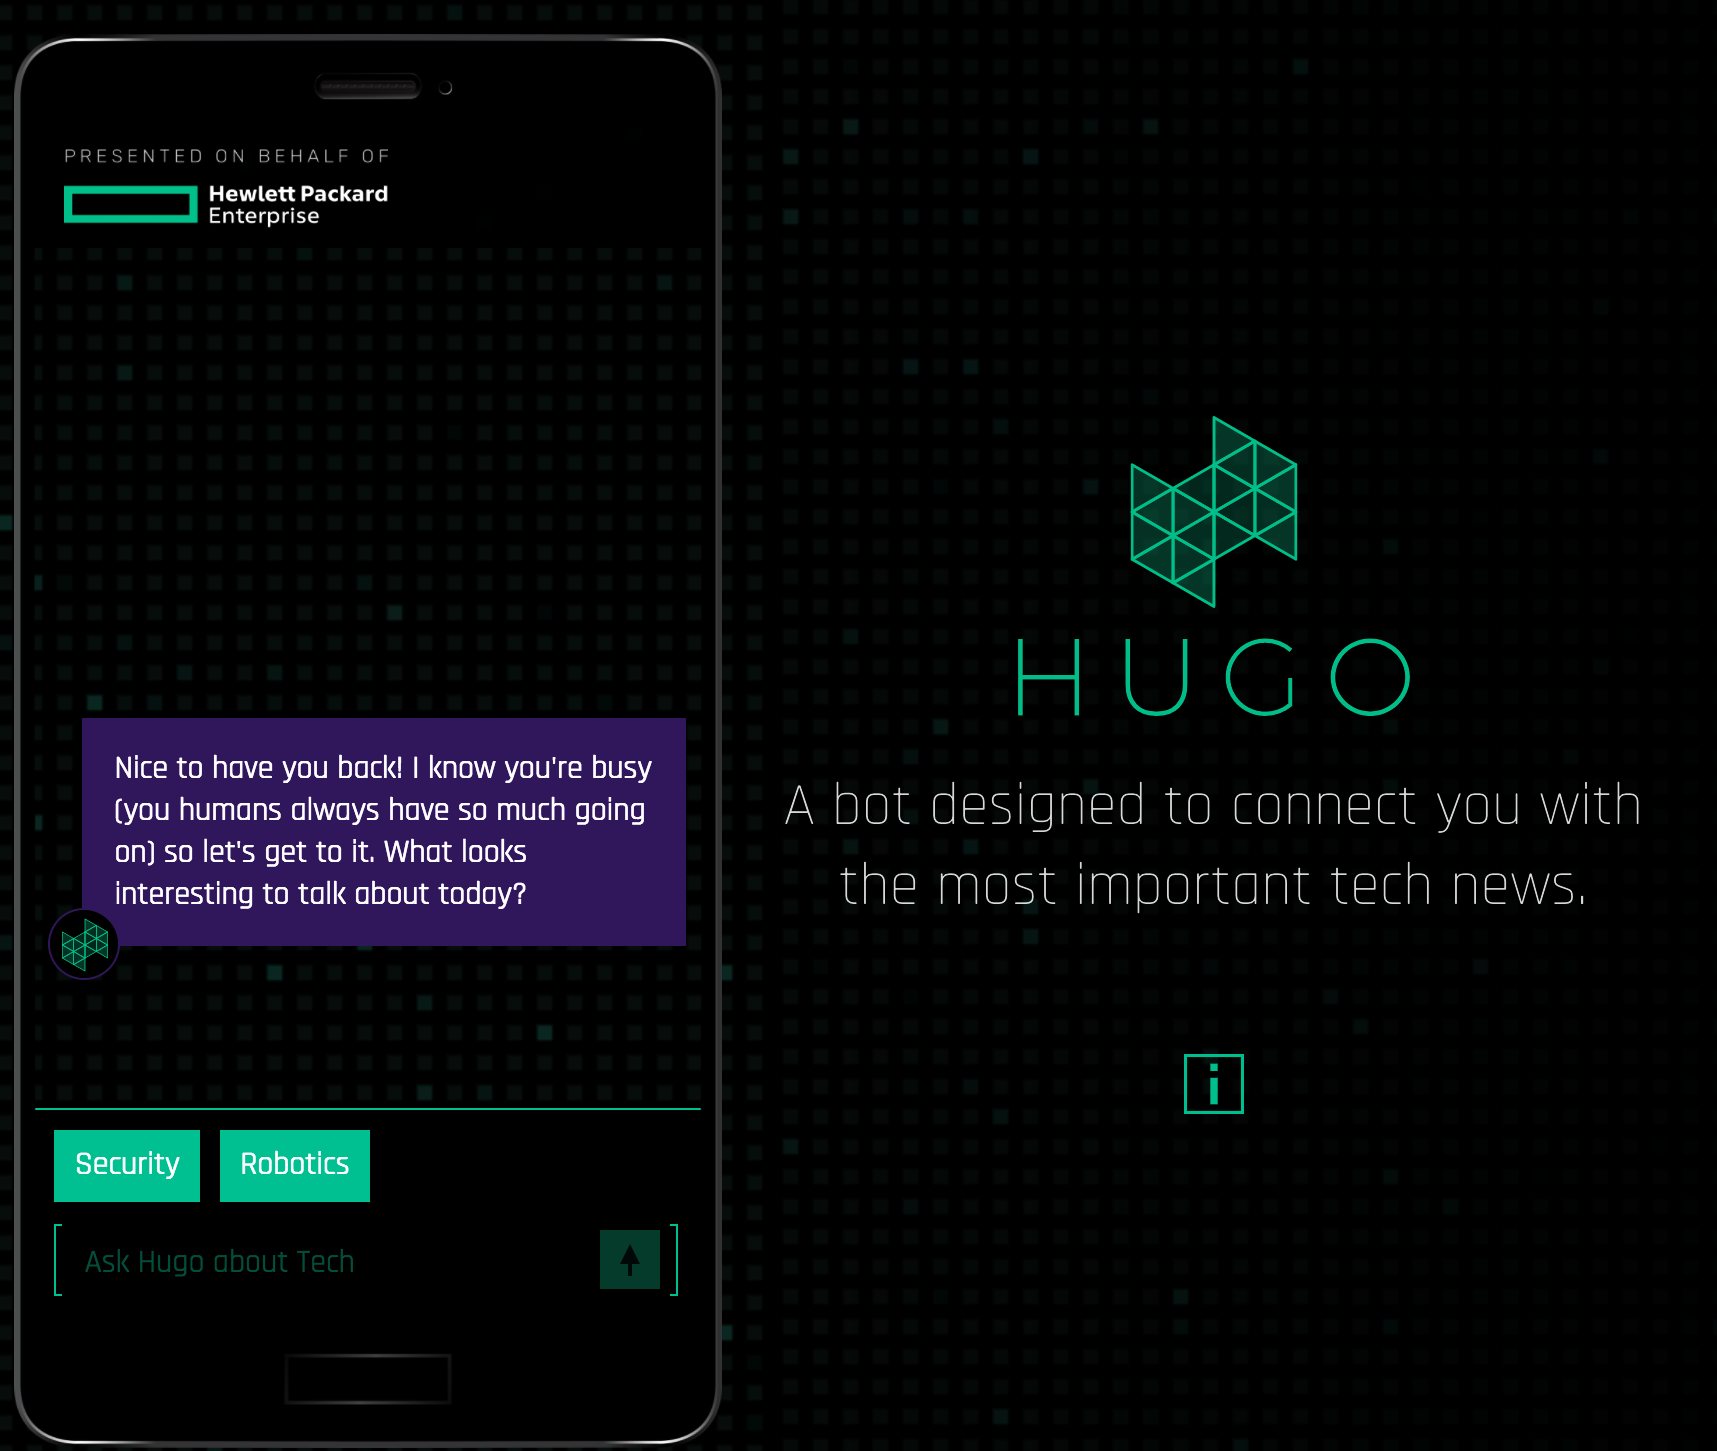
The conversational AI chatbot, named Hugo, provided HPE with a new method of engaging with potential clients.
The bot used natural language processing to share information about 12 industry topics, such as security, quantum computing, artificial intelligence, etc.
THE SITUATION
Hewlett Packer Enterprise's gated content had a fatal flaw: 8% conversion rate and 40% fake data. At $180 per qualified lead, HPE was paying 2.5x the industry benchmark for low-quality leads.
A qualified lead was defined as 7 of 10 data points: First name, last name, company, phone, email, country, budget, role, need, and timing of need.
EXECUTION
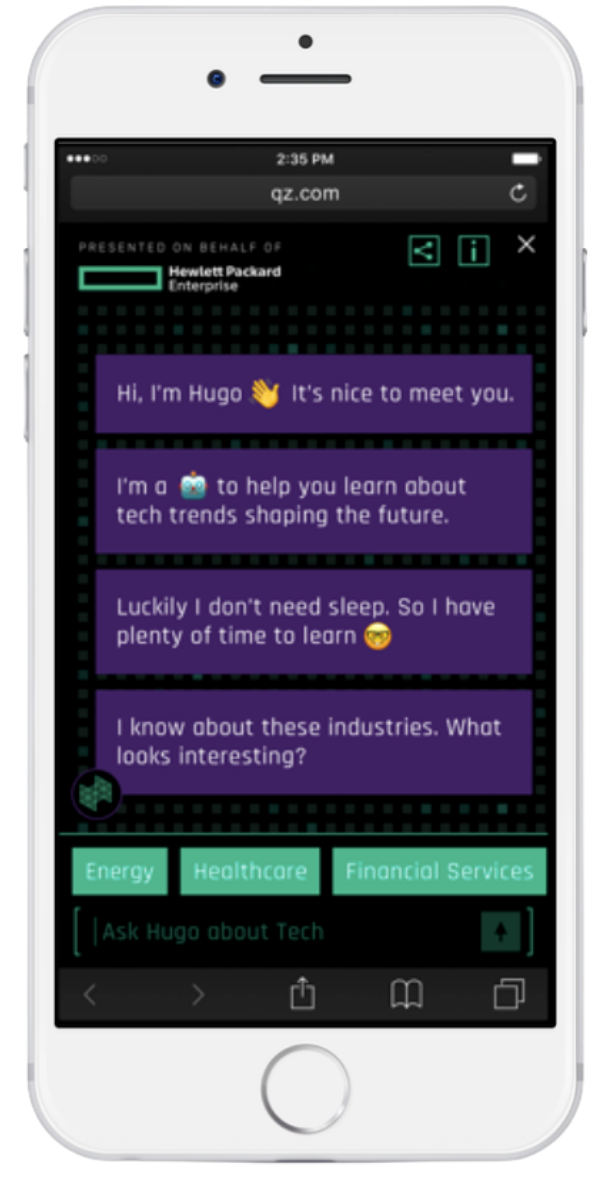
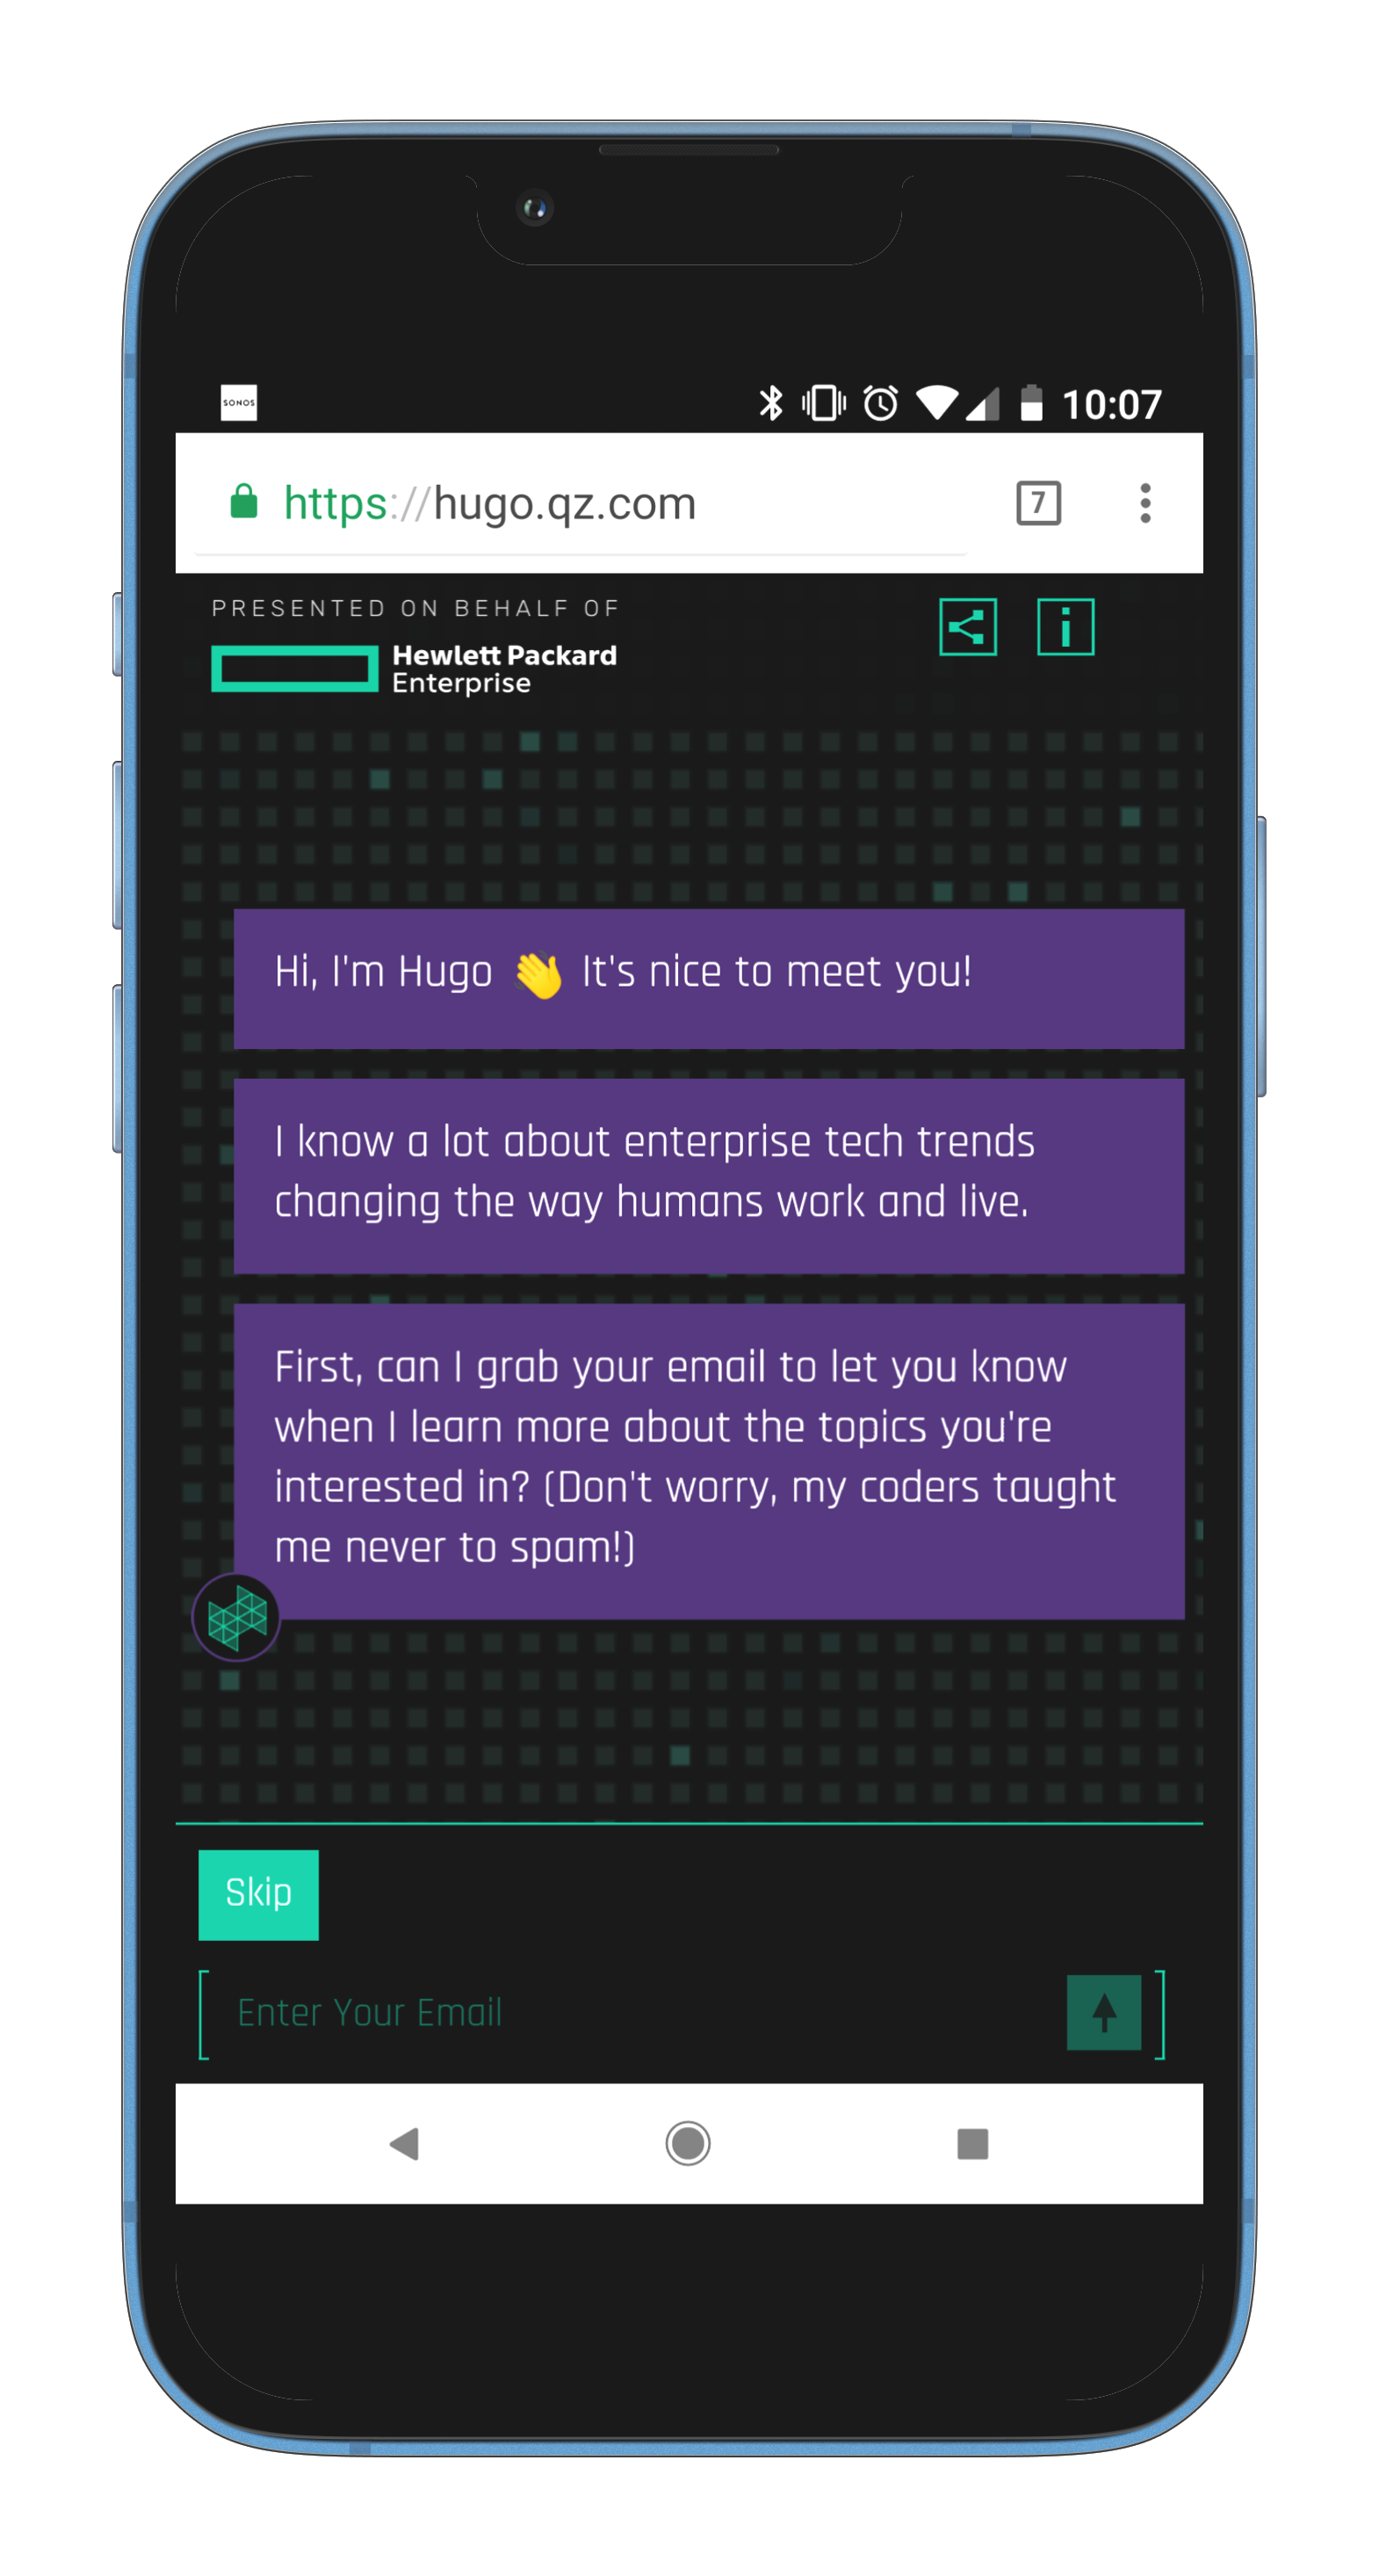
Hugo’s premise was to share expert facts that resonated with HPE’s client base: AI, Security, Cloud, etc. Interaction with the bot shared content from experts by topic or industry. The user could also set an alert for major content updates on a industry, topic or a specific insight.
Release 1 with static content for insights gathering and testing model
Release 2 using an LLM for NLP interactions by theme and industry
Content management system for managing usage and content.
Release 1
This release used static buttons and content so we could validate the concept and interactions.
My Role
Establish the Hugo’s flow
Map and cross-link content by industry and topic
Conduct user research with six people
Alpha Version
Content Mapping
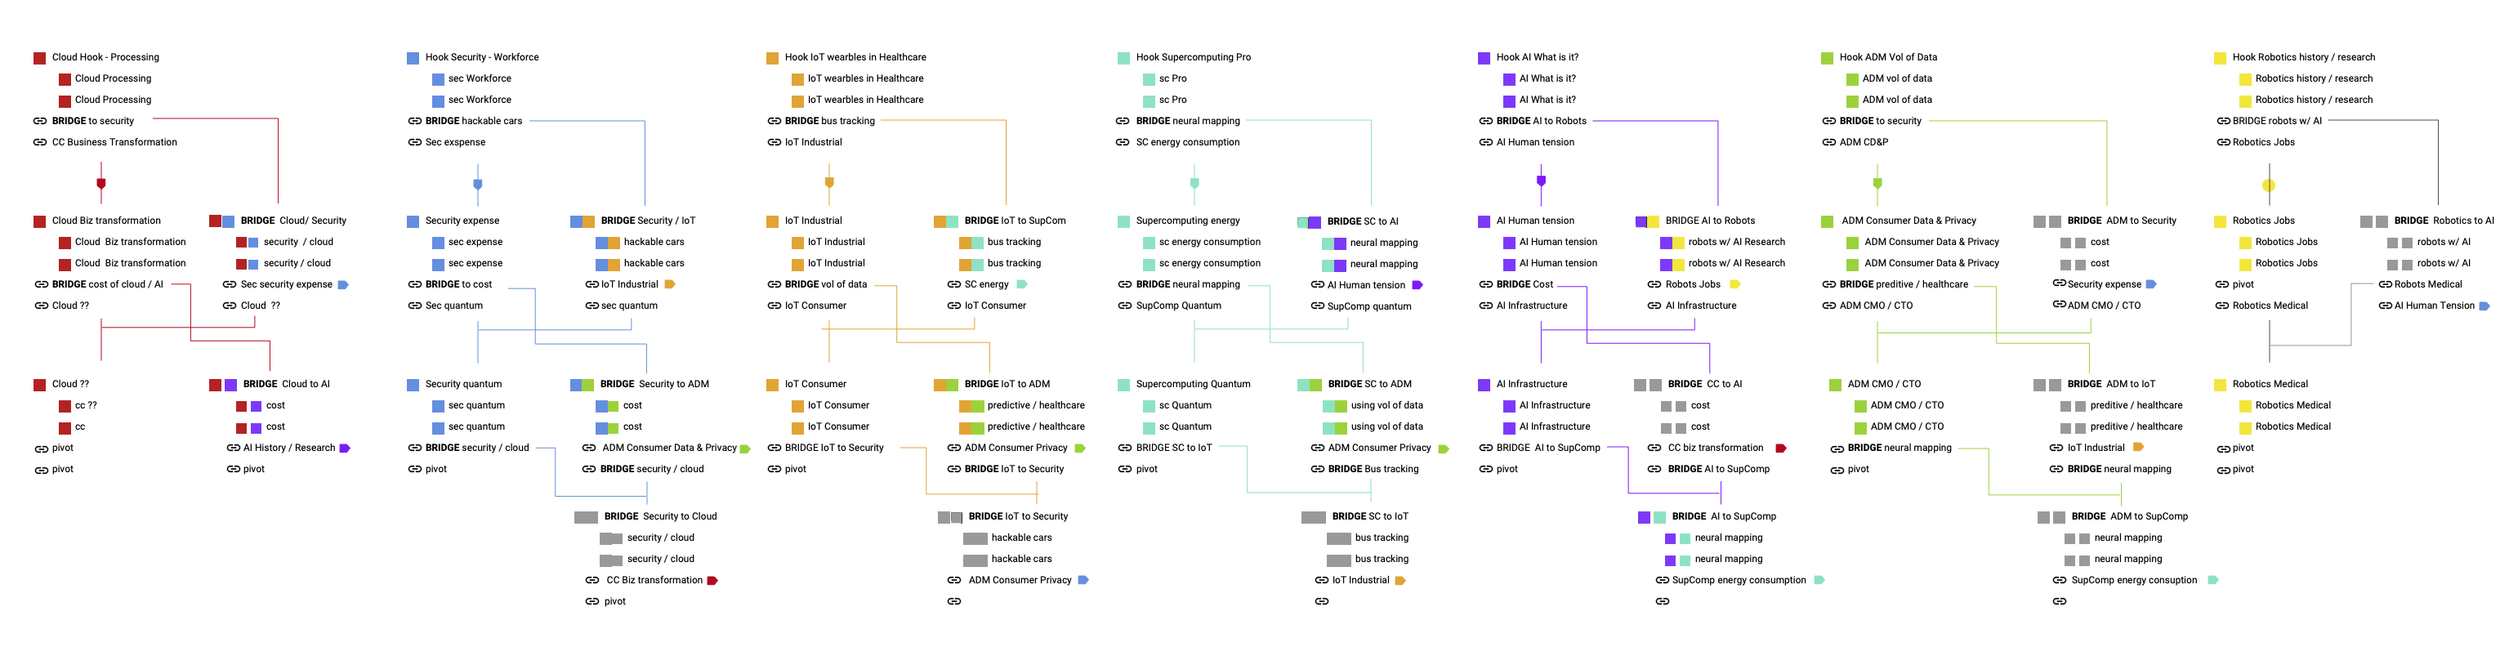
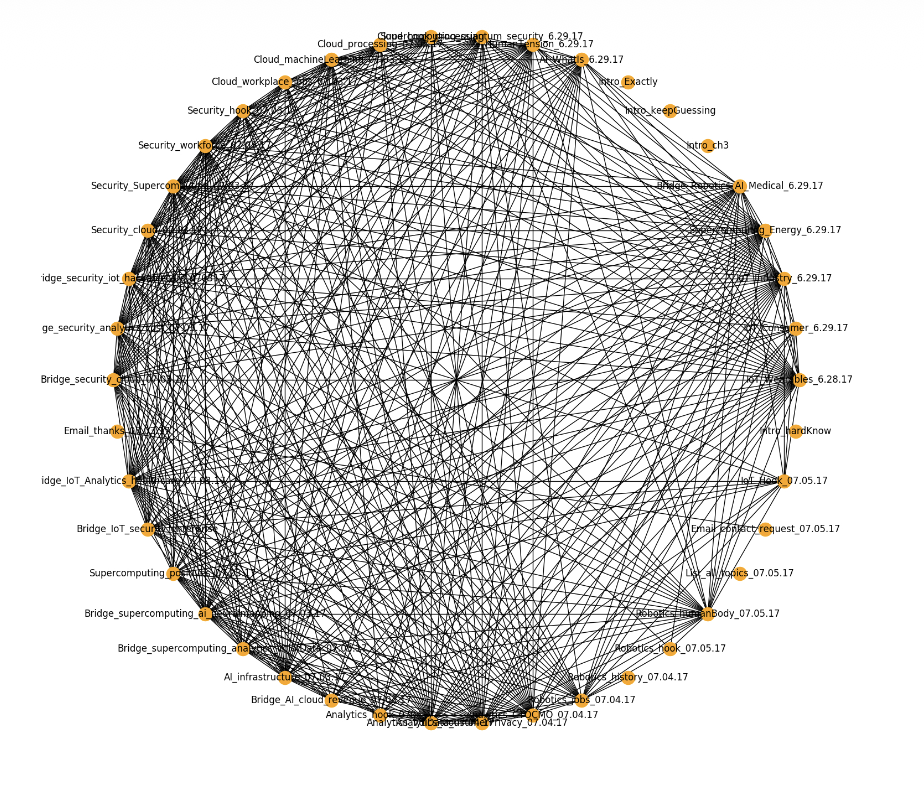
I mapped the 38 pieces of content, linking by topic or industry. It started as a stickie exercise and turned into this structured diagram. I collaborated with the editorial team, who wrote the blurbs.
User Research
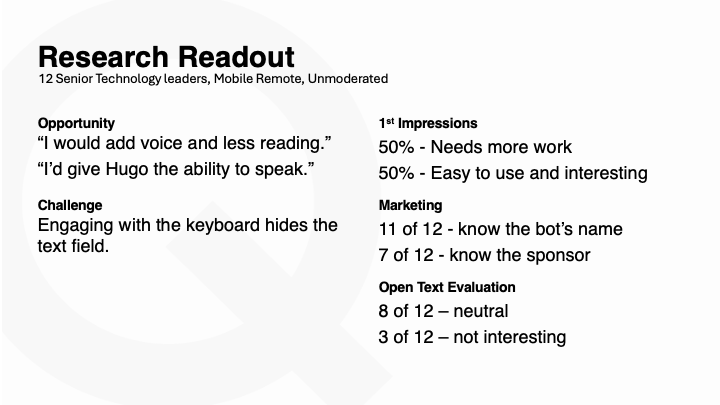
I wrote the research plan and interviewed 6 decision-makers to evaluated Hugo’s premise, branding, and interaction design.
The marketing aspect of Hugo was successful, however the data capture was not. I took the feedback and changed the pacing of capturing lead generation information.
Analytics
I recommended tracking the duration of visits, popularity of topics in partnership with the analytics team.
I love this diagram. The data sheet wasn’t resonating. This diagram promoted the value of tracking topics and duration. It informed my proposal for pacing questions about the user.
User Flow
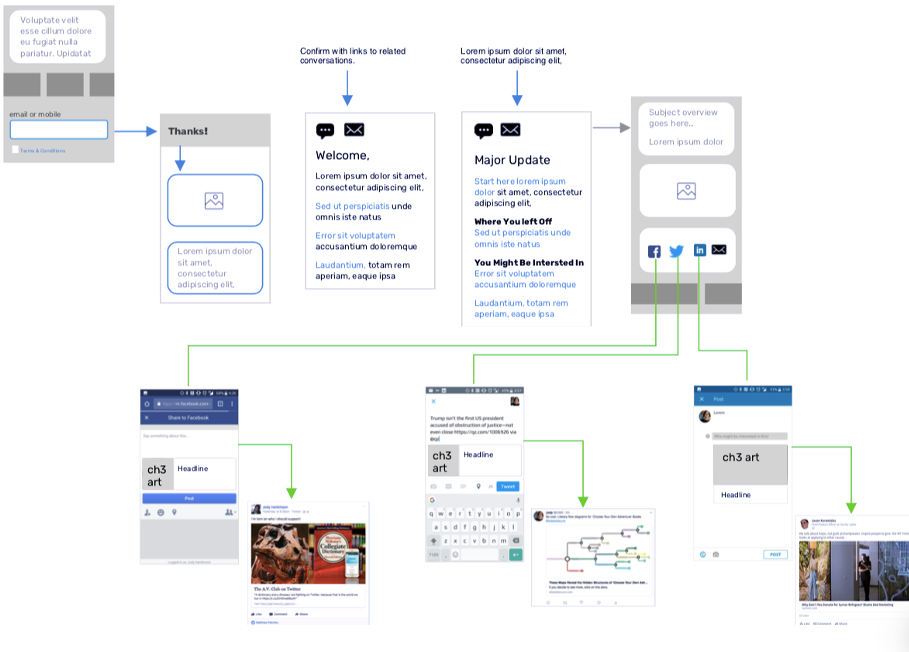
I designed the pathing and interaction design, including the crucial ability to share. The content card flipped, and the user was given four share options: Facebook, Twitter, LinkedIn and email.
Release 2
We launched with a true Generative AI experience.
My Role
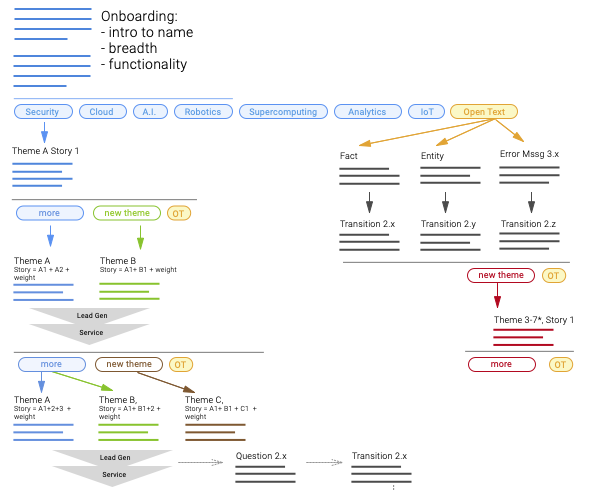
Conversational design and pacing for lead generation prompts
Create the LLM framework and taxonomy
Define conversational elements such as error messages for three audience groups: new, returning, user visiting from a referral
Design and concept the content management system (CMS)
Launch Version
Conversational Design
I changed the pacing for capturing demographics. I redesigned to progressive requests for data - users consumed 2-3 content nodes before sharing demographics. It eliminated the intrusive request for user demographics and spaced it out.
My framing to the team, “You wouldn’t meet someone at a party and start by ask for their social security number.”
Content Management System
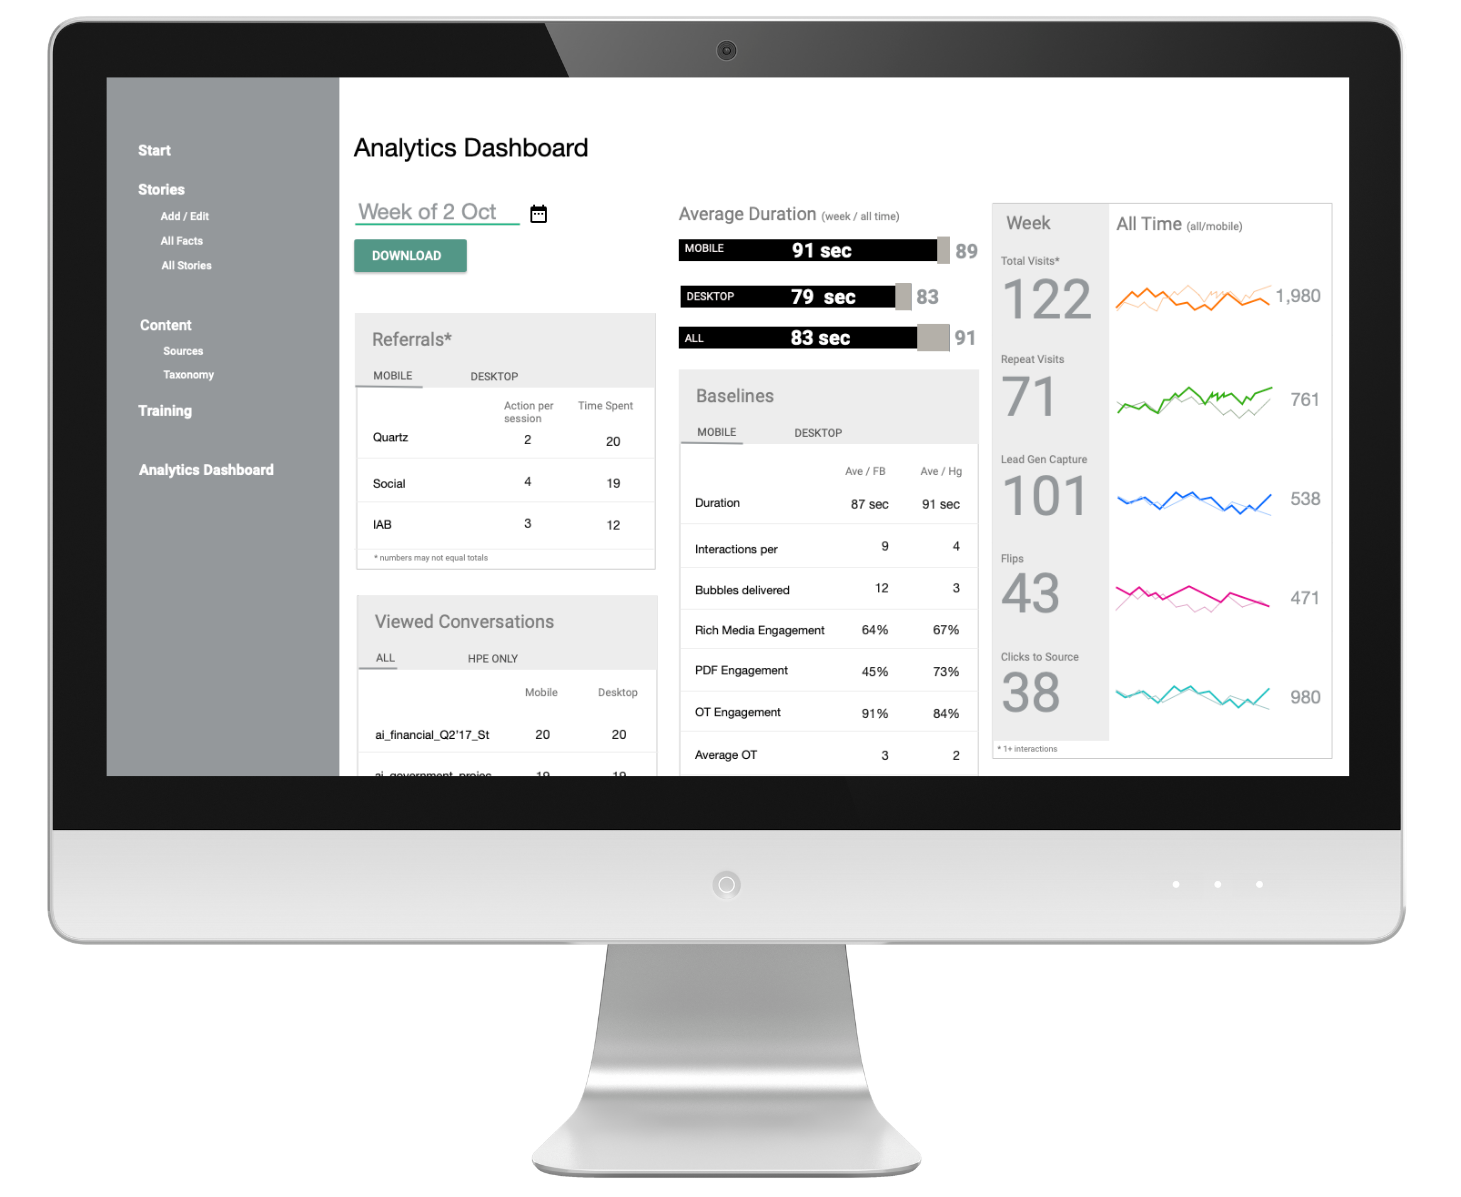
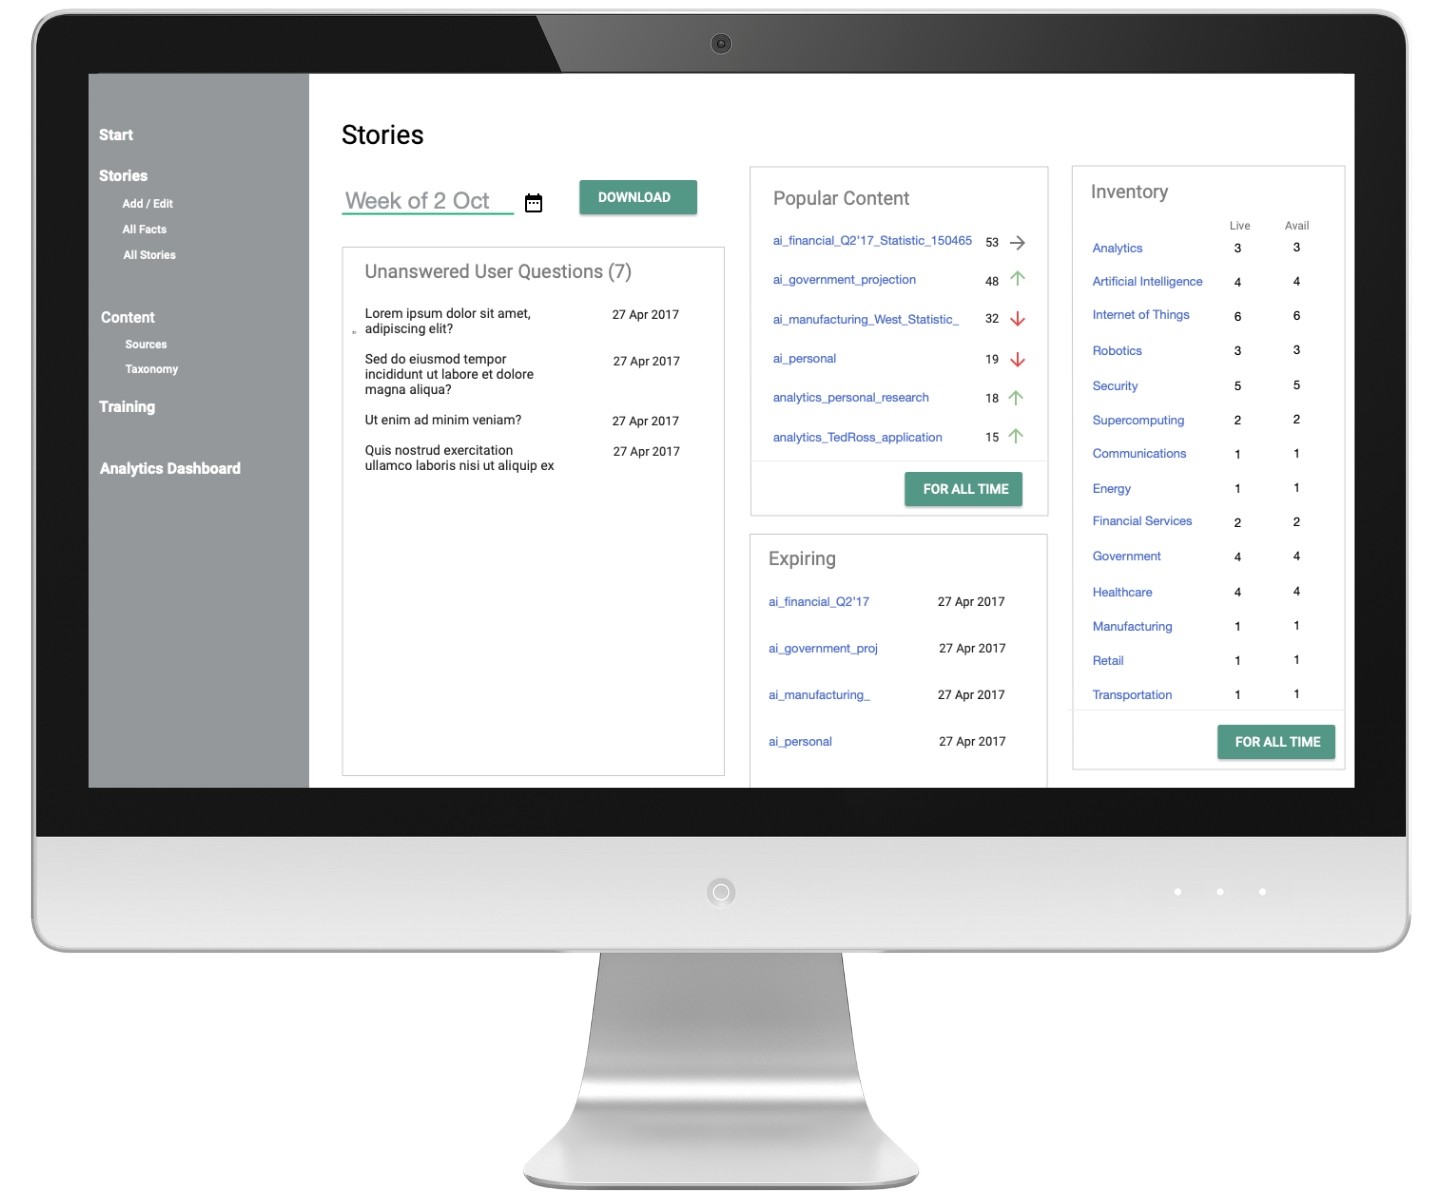
I designed a custom CMS and analytics dashboard, reducing iteration cycles from 2 weeks to 2 days.
For the data visualization, I used micro data in combination with hierarchy for analytics and success metrics.
Content Management System
Wire frames for an administrative platform for teams to track usage (left) and manage content (right).
CHALLENGES
Sales
Wanted all lead data upfront. A 1.5 release found 60% more completions using progressive capture
I reframed the approach as "more qualified leads" not "slower capture."
Engineering
Wanted a sophisticated NLP first. I persuaded the team to wait for the user testing. I reframed the situation to understand pacing before building complexity.
Release 1 generated training data for Release 2.
COLLABORATORS
Product owners
Engineers and QA
Analytics engineers
Client partners
Advertising agency
Sales and Marketing